Strategic Petroleum Reserve: The U.S. Department of Energy announced that scheduled crude oil deliveries to the Strategic Petroleum Reserve will be delayed until the end of 2025 due to ongoing site maintenance, pushing completion up to seven months behind schedule. Of the 15.8 million barrels planned for delivery from January to May, only 8.8 million have been delivered so far. The former Biden administration previously released 180 million barrels from the SPR in 2022 to combat soaring fuel prices after Russia’s invasion of Ukraine, marking the largest sale in history. President Trump has pledged to refill the SPR to capacity, though Energy Secretary Chris Wright estimates it will take years and $20 billion to restore it fully, with only $1.5 billion currently allocated. Wright criticized Biden’s SPR sale, citing $280 million in damages from emergency repairs, oil movement, and maintenance delays. However, the Biden administration said it repurchased 59 million barrels at an average price below $76 per barrel, generating a reported profit of $3.5 billion compared to the original $95 per barrel sale price.
Crude Stocks: Oil prices rose slightly on Friday but were still on track for their steepest weekly decline since March 2023, as the Iran-Israel ceasefire erased the recent geopolitical risk premium. Analysts noted that the market has shifted back to focusing on fundamentals, including the upcoming July 6 OPEC+ meeting, where a production increase of 411,000 barrels per day is anticipated. Strong draws in middle distillates, reflected in falling inventories in the U.S., the ARA hub, and Singapore, helped support prices amid rising demand and refinery activity. U.S. Energy Information Administration data confirmed increased refining and fuel usage. Meanwhile, China’s Iranian oil imports surged to a record 1.8 million barrels per day in June, driven by improved demand from independent refineries and accelerated pre-conflict shipments.
Gulf Shipping Costs: Shipping costs in the Gulf have declined in the past two days following a ceasefire between Israel and Iran, though rates may rise again if tensions return. Supertanker freight rates had more than doubled to over $60,000 per day during the conflict but dropped to around $50,000 on Thursday. War risk insurance premiums for Gulf shipments have also eased, falling to 0.35%-0.45% from a peak of 0.5%, reducing voyage costs significantly. Greece relaxed Hormuz transit reporting requirements, citing improved conditions, while analysts note that both freight and insurance markets are responding to the political de-escalation. However, the situation remains volatile, with Iran warning it would strike U.S. bases if attacked again.
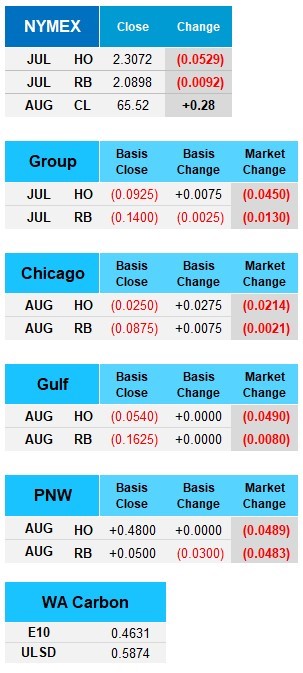
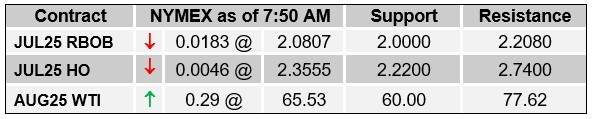
Market Overview: Oil prices are experiencing their steepest weekly decline since March 2023, falling around 12% as the market shifts back to fundamentals amid signs of oversupply. The geopolitical risk premium has faded following the Iran-Israel ceasefire, with Goldman Sachs estimating just a 4% chance of significant supply disruption, pushing Crude prices back into the $60s. Despite the broader decline, prices found some support from tighter U.S. crude inventories and falling middle distillate stockpiles in key global hubs including Europe and Singapore. Energy futures are ending the week a little slow as crude is up $0.29 to $65.53, HO is down $0.0046 to $2.3555, and RBOB is down $0.0183 to $2.0807.
Understanding a Candlestick Chart
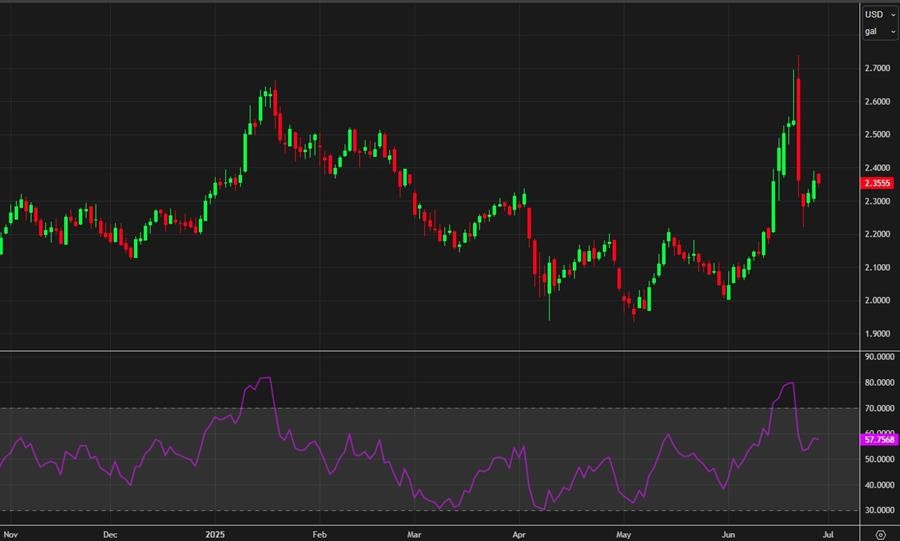
Candlestick charting is a widely used technical analysis tool that helps traders visualize and analyze price movements in financial markets. Each candlestick represents a specific time period and shows the open, close, high, and low prices of an asset. The real body of the candlestick illustrates the range between the open and close, while shadows (or wicks) show the highest and lowest prices reached. A green or white body indicates a bullish (upward) move, while a red or blackbody indicates a bearish (downward) move. Traders use candlestick charts to identify trends, reversals, support and resistance levels, and overall market sentiment. Specific candlestick patterns, such as hammers, dojis, and shooting stars, can signal potential price direction or market indecision. The main advantages include visual clarity, detailed price information, and effective trend identification. However, candlestick analysis can be complex for beginners, may produce false signals, and relies heavily on historical data.
The energy complex finished the week with surprising moves supported by strong seasonal demand during the U.S. summer driving season, which pushed crude inventories to their lowest level for this time of year in over a decade. Continued geopolitical tensions also played a role today as markets reacted to easing fears from the recent Israel and Iran conflict following signs of a ceasefire. Risks remain elevated due to Iran’s ongoing threat to close the Strait of Hormuz, a vital artery for global oil shipments. A weaker U.S. dollar added to mild crude price pressure, making oil more affordable for international buyers. OPEC+ also announced another possible increase of 411,000 barrels per day of production in the month of August which would be about 1.78 million barrels per day, up from 1.37 million barrels per day for the month of July. OPEC+ pumps about half of the worlds oil. To end the week crude oil finished bullish by $0.28 to $65.52 a barrel, while HO went down to $2.3072 and RBOB down to $2.0898.